[ad_1]
Key cis elements underpinning RNA nuclear export
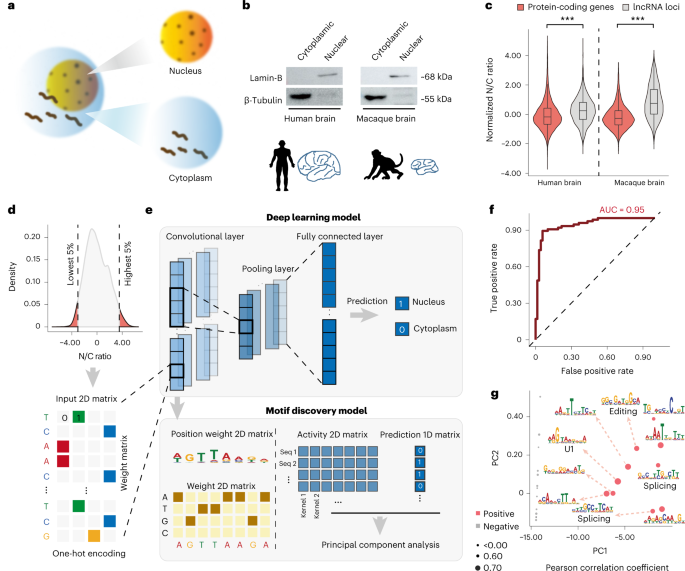
While we and others have proposed the origination of human de novo genes from lncRNA loci, the detailed evolutionary process of this lncRNA–mRNA transition has yet to be fully delineated at the molecular level. Interestingly, although they share the similar transcript structure (the exon–intron structure, capped at 5′ ends and polyadenylated at 3′ ends) and transcriptional regulations, lncRNAs significantly enrich in the nucleus fraction relative to mRNAs15,25. Therefore, to address this issue from a spatial perspective, we first performed RNA sequencing (RNA-seq) studies on fractional brain tissues (Fig. 1a,b) from human and macaque, and introduced the N/C ratio (the ratio of reads in the nucleus to reads in the cytoplasm), a parameter showing efficiency comparable to the chromatin/total ratio in previous reports54 (Extended Data Fig. 1), to quantify the levels of nuclear export activity for each mRNA and lncRNA (Methods). Consistent with the previous findings, lncRNAs showed significantly higher N/C ratios than mRNAs in both species’ brain tissues, indicating the enrichment of lncRNAs in the nucleus (Fig. 1c; Wilcoxon test, P < 2.2 × 10⁻¹⁶). Similar results were found in cell lines of human and rhesus macaque (Extended Data Fig. 2).
a, Overview of the experimental design. b, Western blots showing the protein expression of lamin-B and β-tubulin in nuclear and cytoplasmic fractions from human/macaque brain tissue. c, Distribution of normalized N/C ratios of mRNAs and lncRNAs in brain tissue. n = 15,734 mRNAs and 1,861 lncRNAs for human; n = 15,180 mRNAs and 2,719 lncRNAs for macaque; two-sided, unpaired Wilcoxon test, P < 2.2 × 10⁻¹⁶ and P < 2.2 × 10⁻¹⁶, respectively. The boxes represent interquartile range, with the line across the box indicates the median. The whiskers extend to the lowest and the highest values in the dataset. ***P ≤ 0.001. d, Sequences of transcripts excessively distributed in the nucleus or cytoplasm in HEK293T cells. e, Deep learning classification model to investigate the key cis elements underpinning the varied transcript nuclear export activity. f, Evaluation metrics, as well as features of prediction for the classification model, are shown. g, Key cis elements differentiating transcripts with varied nuclear export activity were identified by prioritizing the activation values in the first convolutional layer of this CNN network.
On the basis of the sequences of transcripts excessively distributed in the nucleus or the cytoplasm (Fig. 1d), we then developed a deep learning classification model to investigate the key cis elements underpinning the nuclear export of transcripts (Methods). Briefly, a convolutional neural network (CNN) was developed with multiple convolutional/pooling layers and one fully connected layer (Fig. 1e), which efficiently predicted the nuclear export activity of transcripts with their sequences (area under the curve 0.95; Fig. 1f). We then extracted the key cis elements differentiating transcripts with varied nuclear export activity by prioritizing the activation values in the first convolutional layer of this CNN model. Notably, the existence of the U1 binding motif (recognized by the U1 small nuclear ribonucleoprotein) in the transcript was identified as the predominant element in predicting the localization of the transcripts (Fig. 1g). Some RNA splice-related sequences were also identified as informative cis elements in predicting the localization of the transcripts (Fig. 1g and Supplementary Table 1). These findings thus highlight the predominant contributions of these cis elements to the varied subcellular distributions of transcripts.
Switching of key features in de novo gene origin
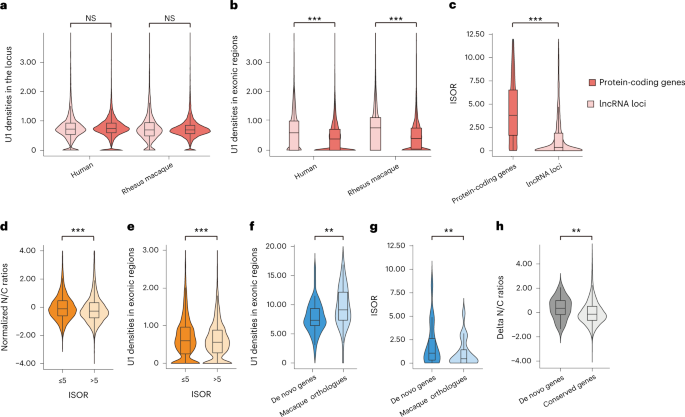
We then investigated whether the distribution of these cis elements, especially the U1 binding sequences, could be used to explain the varied enrichment of subcellular localization of mRNAs and lncRNAs. Notably, although the density of U1 sequences was comparable between the loci encoding lncRNAs and the loci encoding mRNAs, the lncRNA transcripts showed a significantly higher exonic U1 density in both human (Wilcoxon test, P < 2.2 × 10⁻¹⁶) and rhesus macaque (P < 2.2 × 10⁻¹⁶) (Fig. 2a,b), indicating the involvement of RNA splicing in shaping this mRNA–lncRNA difference in the U1 density of the transcripts.
a,b, Box plots showing the density of strong U1 binding sites (in number of sites per kilobase) in the genic (a) and exonic regions (b) of genes encoding mRNAs and lncRNAs. n = 55,187 for human protein-coding genes; n = 2,615 for human genes encoding lncRNAs; n = 25,620 for macaque protein-coding genes; n = 616 for macaque genes encoding lncRNAs; statistics for a: one-sided, unpaired Wilcoxon test; statistics for b: one-sided, unpaired Wilcoxon test, P < 2.2 × 10⁻¹⁶ and P < 2.2 × 10⁻¹⁶, respectively. c, Distributions of ISOR scores for mRNAs and lncRNAs in the nuclear fraction of the human brain. n = 18,084 for mRNAs; n = 2,823 for lncRNAs; statistics for c: one-sided, unpaired Wilcoxon test, P < 2.2 × 10⁻¹⁶. d,e, Distributions of the normalized N/C ratio (d, n = 14,604 mRNAs; one-sided, unpaired Wilcoxon test, P < 2.2 × 10⁻¹⁶) and exonic U1 density (e, n = 14,604 mRNAs; one-sided, unpaired Wilcoxon test, P = 6.4 × 10⁻⁶) for mRNAs with different ISOR scores. f,g, Distributions of the density of all U1 binding sites (f, in number of sites per kilobase, n = 50 for de novo genes; n = 45 for their macaque orthologues encoding lncRNAs; one-sided, unpaired Wilcoxon test, P = 1.7 × 10⁻³) and ISOR scores (g, n = 19 pairs; one-sided, paired Wilcoxon test, P = 5.3 × 10⁻³), in de novo genes and their macaque orthologues encoding lncRNAs. h, Box plots showing the difference of N/C ratios between de novo genes and their macaque orthologues encoding lncRNAs in brain tissues. As we attempted to compare the de novo genes with the background, the differences of N/C ratios between orthologue pairs in macaque and human are shown. n = 32 for de novo genes; n = 12,210 for all orthologue pairs; one-sided, unpaired Wilcoxon test, P = 5.3 × 10⁻³. The boxes represent interquartile range, with the line across the box indicates the median. The whiskers extend to the lowest and the highest value in the dataset. **P ≤ 0.01; ***P ≤ 0.001; NS, not significant.
To estimate the average degree of RNA splicing for each gene, we then defined the parameter isoform spliced-out ratio (ISOR) to calculate the ratio of the spliced out length to the exon length of the transcript from the RNA-seq data (Extended Data Fig. 3a and Methods). The ISOR score accurately quantified the average splicing efficiency at the whole-transcript level, as verified by comparison with the full-length transcript sequencing data of the same sample (Extended Data Fig. 3b and Methods). We then compared the ISOR scores for genes encoding mRNAs and lncRNAs and found that the protein-coding genes had significantly higher scores than those encoding lncRNAs, suggesting a higher splicing efficiency among mRNA transcripts in general (Fig. 2c; Wilcoxon test, P < 2.2 × 10⁻¹⁶). Notably, for mRNAs encoded by human protein-coding genes, the degree of RNA splicing efficiency is negatively correlated with the N/C ratio (Wilcoxon test, P < 2.2 × 10⁻¹⁶) and the exonic U1 density (Wilcoxon test, P = 6.4 × 10⁻⁶) for the corresponding transcripts (Fig. 2d,e). Taken together, it is plausible that RNA splicing could regulate the nuclear retention of the corresponding transcripts through the modulation of exonic U1 density, contributing to the differences between mRNAs and lncRNAs in nuclear export activity.
To investigate whether nuclear export activity increases along with the de novo gene origination from ancestral lncRNAs, we first updated the list of human- and hominoid-specific de novo genes on the basis of our previous studies7,14, by integrating additional de novo genes supported by new translational evidence from ribosome-profiling data and large-scale mass spectrometry (Extended Data Fig. 4a and Methods). Overall, 74 de novo genes were identified in human, including 45 genes encoding human-specific proteins and another 29 hominoid-specific genes encoding similar proteins in human and chimpanzee but not in rhesus macaque (Supplementary Table 2). The characteristics of these de novo genes, such as higher GC level, relatively smaller open reading frames (ORFs), lower expression levels and co-opting the transcriptional context of cis natural anti-sense transcripts (NATs) or bidirectional promoters, are consistent with previous reports7,10,55 (Extended Data Fig. 4b,e–g).
We then examined the degrees of RNA splicing, exonic U1 density and the nuclear export of the mRNAs encoded by these de novo genes, as well as those of the lncRNAs encoded by the macaque orthologues of these de novo genes, in the brain tissue of humans and rhesus macaques (Fig. 2f–h). Consistently, compared with the lncRNAs encoded by the macaque orthologues, the mRNAs encoded by these de novo genes showed significantly lower exonic U1 density (Wilcoxon test, P = 1.7 × 10⁻³; Fig. 2f) and higher ISOR values (Wilcoxon test, P = 5.3 × 10⁻³; Fig. 2g). Moreover, in contrast to the 12,210 conserved orthologue pairs between human and rhesus macaque as a background, transcripts encoded by the de novo genes showed a significantly decreased N/C ratio compared with those lncRNAs encoded by their macaque orthologues (Wilcoxon test, P = 5.3 × 10⁻³; Fig. 2h). Taken together, the switching of the degrees of RNA splicing, exonic U1 density and nuclear export appears to occur along with the process of de novo gene origination.
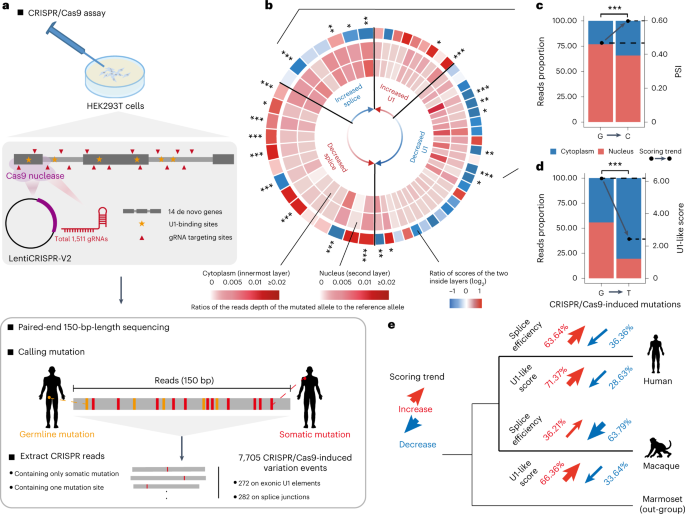
To further clarify the causal relationship among RNA splicing, U1 regulation and nuclear export of these de novo genes, we designed a clustered regularly interspaced short palindromic repeats (CRISPR)/Cas9 library with 1,511 guide RNAs (gRNAs) to target splice junctions and exonic U1 sequences on 14 multiple-exon de novo genes moderately expressed in HEK293T cells (fragments per kilobase of transcript per million mapped fragments (FPKM) >0.5). These gRNAs introduced random mutations at these sites (Methods, Fig. 3a, Extended Data Fig. 5 and Supplementary Table 3). After transfection, the nuclear and cytoplasmic fractions of these de novo genes were then polymerase chain reaction (PCR) amplified and subjected to deep sequencing (Methods). Overall, we identified 7,705 CRISPR/Cas9-induced mutations: 272 were located on exonic U1 sites, and 282 on splice junctions.
a, Schematic of the CRISPR/Cas9 library design and targeted sequencing of de novo genes expressed in HEK293T cells. b, Mutations identified in U1/splice sites and their effects on the nuclear/cytoplasmic distribution of the corresponding transcript. The innermost layer and the second layer of the circular heat map show the ratios of the reads depth of the mutated allele to the reference allele in the nucleus (the second layer) and cytoplasm (the innermost layer), respectively. The ratio of scores of the two layers are shown on the outermost layer, in which the blue and red correspond to the odds ratio of N/C ratios between the mutants and the wild-type controls, respectively. According to the benchmark scale bar, the blue codes indicate that the mutation introduce a decreased N/C ratio for the corresponding transcript (increased nuclear export activity), while the red codes indicate that the mutations introduce an increased N/C ratio of the corresponding transcript (or decreased nuclear export activity). The mutations are ranked according to the differences in the U1 score (right part of the circular heat map) or the PSI value (left part) between the mutant and reference alleles (red arrow, mutants show higher U1 scores or lower PSI; blue arrow, mutants with lower U1 scores or higher PSI than the reference alleles). c,d, Proportions of reads in the nucleus and cytoplasm were shown in red and blue, respectively, for one mutation introducing a stronger splice site (c, two-sided, Fisher’s exact test, P < 2.2 × 10⁻¹⁶) and another mutation introducing a lower U1 score (d, two-sided, Fisher’s exact test, P < 2.2 × 10⁻¹⁶). e, The statistics of the segregating sites fixed after the divergence of human and rhesus macaques during the process of de novo gene origin. The effects of the segregating sites on the activity of RNA splicing and the affinity of U1 binding were predicted, and the proportions of sites with different effects are shown. *P ≤ 0.05; **P ≤ 0.01; ***P ≤ 0.001.
We then characterized the effects of these mutations on the nuclear export of the corresponding transcripts, by comparing the distributions of the RNA-seq reads with the reference allele or mutation allele in the nuclear and cytoplasmic fractions (Methods and Supplementary Table 4). Generally, in contrast to the distribution of the reference alleles, mutations leading to weaker U1 sites increased the cytoplasmic localization of the corresponding transcripts, while mutations leading to stronger U1 sites increased the nuclear localization (Fig. 3b and Supplementary Table 5). Moreover, when calculating and comparing the splicing efficiencies (in per cent spliced in, PSI) of the reference and mutation-containing transcripts, we identified 7 mutations that increased and 14 that decreased the splicing activity of the corresponding transcripts (Methods). Among these sites, 13 sites significantly changed the localization of the corresponding transcripts, with 10 (or 76.9%) supporting the direct regulation of the splicing efficiency on RNA nuclear export, in that mutations leading to stronger splice sites had significantly increased their cytoplasmic localization, while mutations leading to weaker splice sites decreased their cytoplasmic localization of the corresponding transcripts (Fig. 3b and Supplementary Table 5). Two examples with a mutation-induced change in nuclear or cytoplasmic localization are shown in Fig. 3c,d.
Finally, to understand the genetic background underlying such a lncRNA–mRNA transition in de novo gene origination, we identified the segregating sites on their loci that were fixed after the divergence of humans and rhesus macaques, and predicted their effects on the activity of RNA splicing and the affinity of U1 binding (Methods). Interestingly, after the divergence of human and rhesus macaque, most of the segregating sites accumulated in the human lineage led to stronger splice sites (7 of 11, or 63.6%), while most of the segregating sites accumulated in the macaque lineage led to weaker splice sites (37 of 58, or 63.8%) (Fig. 3e). In addition, most of the segregating sites accumulated in human (177 of 248, or 71.4%) or macaque lineages (874 of 1,317, or 66.4%) led to stronger U1 binding, verifying the hypothesis that the U1 elements may function as an intermediate effector to differentiate mRNAs and lncRNAs in terms of subcellular localization, by connecting the regulation of RNA splicing with the regulation of RNA nuclear export (Fig. 3e).
Taken together, these findings suggest that RNA splicing can efficiently regulate the nuclear export of the corresponding transcripts, partially through the removal of intronic U1 sequences, a process contributing substantially to the origin of de novo genes during the recent human evolution.
A selectively constrained boundary in de novo gene origin
To address whether the differences in sequence and expression profiles of lncRNAs explain why de novo genes originate from some lncRNAs but not others, we investigated the orthologous lncRNA loci of de novo genes in rhesus macaques as a proxy for determining ancestral status, assuming that the features of these loci have remained unchanged in the macaque lineage since their divergence from the human lineage.
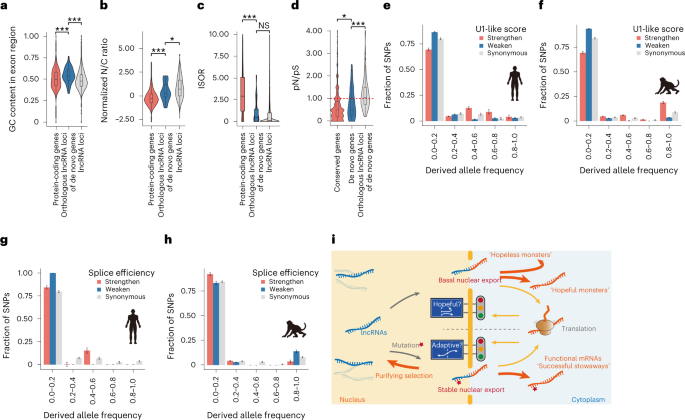
Compared with the genome-wide lncRNA loci and protein-coding genes as the backgrounds, both the de novo genes and their macaque orthologues encoding lncRNAs displayed extreme features of high GC content (Wilcoxon test, P = 5.5 × 10⁻³, P < 2.2 × 10⁻¹⁶, P = 2.5 × 10⁻⁷ and P = 3.0 × 10⁻¹³, for de novo genes and their macaque orthologues in contrast to the genome-wide protein-coding genes or lncRNA-encoding genes, respectively; Fig. 4a and Extended Data Fig. 4b). This observation suggests the involvement of the pre-adaptation model in the origination process. On the other hand, both the de novo genes and their macaque orthologues encoding lncRNAs showed intermediate level of N/C ratio and ISOR in comparison with the genome-wide lncRNAs and mRNAs (Fig. 4b,c and Extended Data Fig. 4c,d), suggesting the involvement of the continuum model and the roles of splice-directed nuclear export as a key step in de novo gene origin. Moreover, we found that the ratios of pN to pS in these de novo genes were generally less than 1, which are significantly lower than those of the lncRNA orthologues of these de novo genes in rhesus macaque (Wilcoxon test, P = 8.4 × 10⁻⁴), and higher than those of the protein-coding genes conserved in human and macaque (Fig. 4d; Wilcoxon test, P = 0.047). It is thus plausible that these de novo genes are generally selectively constrained, with a few de novo genes under strong selection, a substantial proportion of these genes under relatively weaker selection and others under no selection.
a–c, Estimated features of ancestral lncRNAs for the de novo genes identified using their macaque orthologues encoding lncRNAs. The distributions of GC content (a), N/C ratio (b) and splice efficiency (c) of these lncRNAs are summarized in box plots and compared with those of the genome-wide lncRNAs or protein-coding genes in macaques. Statistics for a: n = 25,211 for macaque protein-coding genes; n = 71 for macaque orthologues of human de novo genes; n = 4,370 for macaque lncRNAs; one-sided, unpaired Wilcoxon test, P = 2.5 × 10⁻⁷ and P = 3.0 × 10⁻¹³, respectively; statistics for b: n = 11,703 for macaque protein-coding genes; n = 34 for macaque orthologues of human de novo genes; n = 2,719 for rhesus macaque lncRNAs; one-sided, unpaired Wilcoxon test, P = 2.6 × 10⁻⁵ and P = 2.6 × 10⁻²; statistics for c: n = 13,463 for macaque protein-coding genes; n = 19 for macaque orthologues of human de novo genes; n = 3,702 for macaque lncRNAs; one-sided, unpaired Wilcoxon test, P = 8.0 × 10⁻⁶ and P = 7.4 × 10⁻². d, pN/pS scores in human population are summarized in box plots, for de novo genes, the macaque orthologues of these de novo genes, as well as the protein-coding genes conserved in human and macaque as a control. n = 13,131 for conserved genes between human and macaque; n = 41 for de novo genes; n = 60 for macaque orthologues of human de novo genes; one-sided, unpaired Wilcoxon test, P = 4.7 × 10⁻² and P = 8.4 × 10⁻⁴. The boxes represent interquartile range, with the line across the box indicates the median. The whiskers extend to the lowest and the highest value in the dataset. e,f, Derived allele frequency spectra for the human polymorphic sites that led to stronger (Strengthen, n = 78 SNPs) or weaker U1 sites (Weaken, n = 175 SNPs) in de novo genes (e), as well as the macaque polymorphic sites that led to stronger (Strengthen, n = 119 single-nucleotide polymorphisms (SNPs)) or weaker U1 sites (Weaken, n = 307 SNPs) in macaque orthologues of these de novo genes (f). g,h, Derived allele frequency spectra for the human polymorphic sites that introduce stronger (Strengthen, n = 10 SNPs) or weaker splice sites (Weaken, n = 28 SNPs) in de novo genes (g), as well as the macaque polymorphic sites that introduce stronger (Strengthen, n = 28 SNPs) or weaker splice sites (Weaken, n = 44 SNPs) in the macaque orthologues of de novo genes (h). Derived allele frequency spectra for synonymous sites (Synonymous, n = 130 SNPs and 268 SNPs) in human and macaque are also shown as neutral controls; error bars, standard deviations (s.d.) estimated by 1,000 bootstrap replicates. Data are presented as mean ± s.d. *P ≤ 0.05; ***P ≤ 0.001; NS, not significant. i, A ‘successful stowaway’ model for the origin of functional de novo genes from lncRNA loci.
Overall, it seems that the de novo genes acquired gene-like features and biological functions along with their origination. A selection boundary underpinning this pre-adaptive mode of origin should thus, in principle, exist. As we had linked nuclear export activity and cis elements such as RNA splice junctions and U1 sequences to the origin of de novo genes, we then performed a population genetics study in humans and macaques to investigate whether they may function as a selection boundary underlying these features of pre-adaptation. Interestingly, the polymorphic sites weakening the U1 binding sites had an excess of low-frequency variants in the orthologous lncRNA loci of de novo genes, showing a significantly left-skewed frequency spectrum of the derived alleles than that of the synonymous sites as a neutral control (Fig. 4e,f, Monte Carlo P = 9.2 × 10⁻² and P < 1.0 × 10⁻⁴ for human de novo genes and macaque lncRNA loci, respectively). In contrast, the selection pressure on a splice site is directional according to the RNA species, in that the polymorphic sites weaken the splice junctions in mRNAs encoded by the de novo genes, or strengthening those in the lncRNAs encoded by the macaque orthologues of these de novo genes, had an excess of low-frequency variants (Fig. 4g,h, Monte Carlo P < 1.0 × 10⁻⁴ and P = 0.049, for human de novo genes and macaque lncRNA loci, respectively). These findings are in line with the model that the RNA nuclear export acts a selectively constrained boundary between mRNAs and lncRNAs. The new functional genes thus represent ‘successful stowaways’ actively passing through it, showing a mode of pre-adaptive origin in that they acquire functions along with the achievement of their coding potential (Fig. 4i and Discussion).
A de novo gene regulates human cortical development
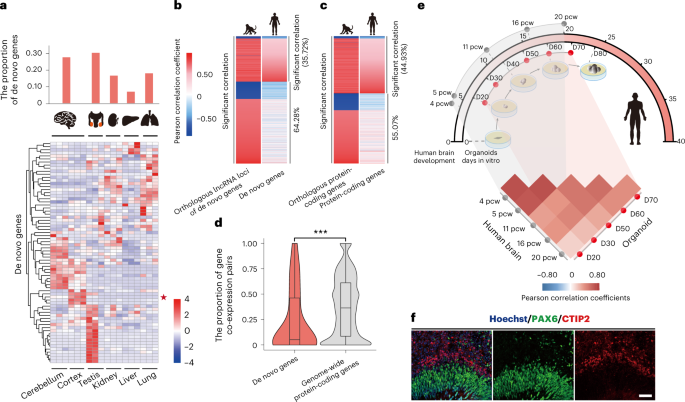
Given the finding that these de novo genes are selectively constrained in general (Fig. 4d), we then investigated their definite functions. Consistent with previous reports, these de novo genes showed brain- and testis-enriched transcriptional expression (Fig. 5a). We then focused on the brain to investigate the effects of these new genes on the human transcriptome, by comparing the cross-species conservation of the correlated genes at the population level. Briefly, on the basis of the transcriptome data from the brains of 35 macaque animals, we identified genes with significant expression correlation with the macaque orthologues of the human de novo genes, and further developed a gene co-expression network. We then investigated the degree of conservation of the network in humans on the basis of transcriptome data from the brains of 134 human individuals. Notably, compared with the conserved genes showing high degrees of cross-species conservation in the gene co-expression network, the conservation level was significantly lower for the young de novo genes with recent lncRNA–mRNA switching after the divergence between human and rhesus macaque (Fig. 5b–d; Wilcoxon test, P = 2.8 × 10⁻⁴). It is thus possible that at least a portion of these de novo genes have acquired new regulatory functions to shape the gene network during the human brain evolution.
a, Heat map showing the tissue expression profile of 72 de novo genes in six human tissues (brain, kidney, liver, lung and testis), with the case gene (ENSG00000205704) selected in the proof-of-concept study marked with a star. Two de novo genes (ENSG00000233290 and ENSG00000205056) not expressed in all of the six types of tissue were not included. b–d, For each macaque gene co-expressed with the macaque orthologues of human de novo genes (b, left), we investigated whether such a co-expressed gene pair is conserved in human (d, right), with the Pearson correlation coefficient between gene pairs shown in the heat maps according to the colour scales. The list of genome-wide protein-coding genes was also shown as a control (c). For each de novo gene, the proportions of the co-expressed gene pairs conserved in human and rhesus macaque were also summarized in the box plot, which were compared with those of the control (d, n = 42 for de novo genes; n = 14,226 for conserved genes between human and macaque; two-sided, paired Wilcoxon test, P = 2.8 × 10⁻⁴), The boxes represent interquartile range, with the line across the box indicating the median. The whiskers extend to the lowest and the highest value in the dataset. e, Schematic plot showing the temporal relationship between the stages of human cortical organoid culture and human foetal brain development, with the correlations of the transcriptome summarized in the heat map. The Pearson correlation coefficients between the transcriptomes of brain tissues and cortical organoids at different stages are shown in the heat map according to the scales. The dotted line highlights the comparisons between pairs of tissue/organoid at comparable developmental stages. 4–20 pcw: post-conceptional weeks 4–20 in early human brain development; D20–70: RNA-seq assays were applied to samples of at four timepoints (protocol days of human cortical organoids 20–70). f, Immunofluorescence staining of PAX6 (green) and CTIP2 (red) in Hoechst-stained (blue) organoids generated from hESCs. Scale bar, 50 μm. The experiment was repeated three times independently with similar results. ***P ≤ 0.001.
To further clarify the biological functions of these newly originated genes, especially in brain development, we employed neural differentiation and cortical organoid systems with human embryonic stem cells (hESCs) to determine whether the new gene could regulate human cortical development (Fig. 5e, top). Notably, the cortical organoids we developed (grown for 60 days) showed tissue-like structures of the developing brain, in that PAX6-positive RGCs and CTIP2-positive neurons could be clearly concentrated in two distinguishable layers, corresponding to the ventricular zone (VZ) and the cortical plate (CP) of a developing neocortex (Fig. 5f). In addition, we generated the transcriptomes of hESC-derived cortical organoids at different stages (days 20, 30, 50, 60 and 70), and compared them with the transcriptome data from the corresponding stages of human brain development (post-conceptional weeks 4, 5, 11, 16 and 20). The transcriptome data in the organoid stages and those of human brain development were well correlated (Fig. 5e, bottom). These findings thus suggest that the cortical organoid system could be used to adequately mimic the early development of the human neocortex and to clarify the functions of de novo genes through the gene knock-out approach.
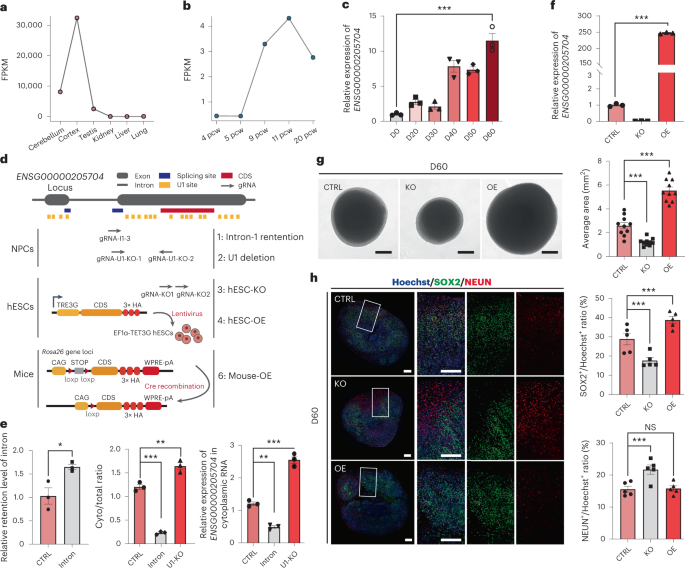
As a proof of concept, we investigated the impact of RNA splicing and U1 recognition sites on one of these newly originated, hominoid-specific de novo genes, ENSG00000205704, which encodes a putative protein of 107 amino acids located in both cytoplasm and nucleus (Extended Data Figs. 6 and 7a). The gene is highly expressed in human brain tissues (Fig. 6a) and showed an increased expression during the development of both human brains and the cortical organoids (Fig. 6b,c). We first attempted to clarify the direct regulation of RNA splicing and U1 recognition sites on the nuclear export efficiency of this gene. To this end, we developed two CRISPR/Cas9 arrays to disrupt the splice site or U1 recognition sites on this gene in human neural progenitor cells (hNPCs, Fig. 6d). Notably, in hNPCs with disrupted splice sites of ENSG00000205704, the splice efficiency of ENSG00000205704 was significantly decreased (Student’s t-test, P = 1.5 × 10⁻³; Fig. 6e, left), and the nuclear export levels of the transcript was decreased accordingly (one-way analysis of variance (ANOVA) test, P < 1.0 × 10⁻⁴; Fig. 6e, middle), in that more transcripts expressed in mutant cells were nuclear localized (one-way ANOVA test, P = 1.0 × 10⁻³; Fig. 6e, right). Meanwhile, when one U1-enriched region at the second exon of ENSG00000205704 was removed via CRISPR/Cas9 assay (Fig. 6d), we detected a significantly increased nuclear export level for the corresponding transcript (one-way ANOVA test, P = 2.1 × 10⁻³; Fig. 6e, middle), and a subsequent increased cytoplasmic expression of this transcript (one-way ANOVA test, P < 1.0 × 10⁻⁴; Fig. 6e, right). These findings thus strengthened the direct regulation of these cis elements on the nuclear export efficiency of this gene.
a–c, The expression profiles of ENSG00000205704 in human tissues (a, relative expression), human foetal brain at different developmental stages (b, FPKM) and human cortical organoids at different protocol days (c, relative expression, n = 3 biologically independent experiments, with a mixture of over ten organoids; data are presented as mean ± standard error of the mean (s.e.m.); two-sided, unpaired Student’s t-test, P = 5.0 × 10⁻⁴). 4–20 pcw: post-conceptional weeks 4–20 in early human brain development; D0–60: protocol days 0, 20, 30, 40, 50 and 60. d, Overview of the gene-editing studies on ENSG00000205704 in hNPCs, hESCs and transgenic mice. The CRISPR/Cas9 gRNAs were designed to target the splice site (Intron-1 retention), U1 binding sites (U1 deletion) and the coding sequence (CDS) regions (hESC-KO) of ENSG00000204705. hESCs with the over-expression of ENSG00000205704 were also developed through lentivirus transfection in hESCs (hESC-OE). Transgenic mice with ENSG00000205704-knock-in were constructed by CRISPR/Cas9 and the ectopical expression was manipulated by Cre recombination (Mouse-OE). e, Left: the effects of the disruptions of the splice site of ENSG00000205704 (Intron) on the levels of intron retention were quantified, compared with the wild type (CTRL). Middle: the nuclear export efficiencies (Cyto/total ratio: the proportion of transcripts located in cytoplasm) of ENSG00000205704 were quantified in wild-type hNPCs (CTRL), in hNPCs with the disruption of the splice site of ENSG00000205704 (Intron) and in hNPCs with six U1 binding sites on the second exon of ENSG00000205704 removed (U1-KO). Right: the expression levels of ENSG00000205704 in cytoplasm for different samples. n = 3 biologically independent experiments, data are presented as mean ± s.e.m. Left: two-sided, unpaired Student’s t-test, P = 1.5 × 10⁻³; middle: one-way ANOVA, P < 1.0 × 10⁻⁴; Dunnett’s multiple comparisons test, Intron versus CTRL P < 1.0 × 10⁻⁴, U1-KO versus CTRL P = 2.1 × 10⁻³; right: one-way ANOVA, P < 1.0 × 10⁻⁴; Dunnett’s multiple comparisons test, Intron versus CTRL P = 1.0 × 10⁻³, U1-KO versus CTRL P < 1.0 × 10⁻⁴. f, The relative expression levels of ENSG00000205704 in hESC-KO and hESC-OE organoids cultured for 60 days (n = 3, data are presented as mean ± s.e.m.; two-sided unpaired Student’s t-test, P < 1.0 × 10⁻⁴; this experiment was repeated three times independently with similar results). g, Left: brightfield images showing the size of organoids generated from hESC (CTRL), hESC-KO and hESC-OE. D60: protocol day 60. Scale bars, 500 μm. Right: quantification of the average area of organoids, according to the brightfield images, n = 10, data are presented as mean ± s.e.m.; one-way ANOVA, P < 1.0 × 10⁻⁴; Dunnett’s multiple comparisons test, KO versus CTRL P = 5.6 × 10⁻⁴, OE versus CTRL P < 1.0 × 10⁻⁴. h, Left: immunofluorescence staining of SOX2 (green) and NEUN (red) in Hoechst-stained (blue) organoids, grown for 60 days from hESCs (CTRL), hESC-KO and hESC-OE. Scale bars, 200 μm. Right: quantification of the immunofluorescence stainings. n = 5 organoids, data are presented as mean ± s.e.m.; top: one-way ANOVA, P = 1.0 × 10⁻⁴; Dunnett’s multiple comparisons test, KO versus CTRL P = 8.1 × 10⁻³, OE versus CTRL P = 1.8 × 10⁻²; bottom: one-way ANOVA, P = 3.0 × 10⁻³; Dunnett’s multiple comparisons test, KO versus CTRL P = 4.0 × 10⁻³, OE versus CTRL P = 9.9 × 10⁻¹. *P ≤ 0.05; ***P ≤ 0.001; NS, not significant.
We then clarified the regulatory roles of this new gene on neurogenesis and human brain development in the human cortical organoid system, showing a moderate expression of this gene (Fig. 6c). To this end, we developed hESCs with over-expression of ENSG00000205704 (hESC-OE), and genetically engineered hESCs with CRISPR/Cas9-mediated knock-out of ENSG00000205704 (hESC-KO) to investigate the effect of ENSG00000205704 over-expression and depletion on the development of human cortical organoids (Fig. 6f, Extended Data Fig. 7b–e and Methods). While the over-expression and depletion of this new gene had no significant effects on the pluripotency of hESCs (Extended Data Fig. 8), the size of the organoids grown from hESC-KO was significantly decreased, in contrast to organoids grown from the wild-type hESCs at the corresponding development periods (Fig. 6g; one-way ANOVA test, P = 5.6 × 10⁻⁴). Meanwhile, the size of the organoids grown from hESC-OE was significantly increased, in contrast to the wild type (Fig. 6g; one-way ANOVA test, P < 1.0 × 10⁻⁴). We then performed immunofluorescence staining with cell-type-specific markers to investigate whether the changes in the cell composition of organoids could contribute to the varied organoid size grown for 60 days. Overall, compared with the organoids grown from wild-type hESCs, the proportion of SOX2-positive cells, indicative of RGCs, was significantly decreased in organoids grown from hESC-KO (Fig. 6h; one-way ANOVA test, P = 8.1 × 10⁻³), while the proportion of the cells marked by NEUN, a nuclear neuronal marker indicative of mature neurons, was significantly increased (Fig. 6h; one-way ANOVA test, P = 4.0 × 10⁻³). Meanwhile, the proportion of SOX2-positive cells was significantly increased (Fig. 6h; one-way ANOVA test, P = 1.8 × 10⁻²) in organoids grown from hESC-OE.
Moreover, as cortical neurons are located in six layers and emerged following a temporal order during the cortical development, we further investigated the changes of the proportions of neurons at different cortical layers. Notably, the proportions of both the layer VI neurons (as marked by TBR1) and the layer V neurons (as marked by CTIP2) changed significantly in organoids grown for 60 days from hESC-KO or hESC-OE, respectively, compared with the wild type, supporting the regulatory roles of ENSG00000205704 in the maintenance of progenitor pool and the maturation of neurons at different cortical layers (Extended Data Fig. 9; one-way ANOVA test, P = 1.8 × 10⁻⁴ and 6.2 × 10⁻⁴, for TBR1 and CTIP2, respectively).
To further investigate the in vivo functions of ENSG00000205704 in cortical development, we generated transgenic mice with ectopical expression of the ORF of ENSG00000205704 (Fig. 6d). Notably, the transgenic mice showed significantly enlarged brains than the wild types in the length of neocortex (P0 stage, Extended Data Fig. 10; Student’s t-test, P = 2.9 × 10⁻⁴) but not in the width of neocortex (Extended Data Fig. 10; Student’s t-test, P = 3.2 × 10⁻¹), and significant cortical expansion was detected, by the immunofluorescence stainings of Ctip2- and Satb2-marked regions indicative of regions with deep-layer neurons and upper-layer neurons, respectively (Extended Data Fig. 10; Student’s t-test, P = 4.7 × 10⁻³ and 1.4 × 10⁻⁴).
Taken together, the organoids grown from hESC-KO appeared to develop and mature at a quicker pace, leading to a significantly decreased size of the organoids during the same developmental periods, while both the organoids grown from hESC-OE and the transgenic mice with ectopically expressed ENSG00000205704 exhibit a delayed neuronal maturation and a subsequent cortical expansion, substantiating the direct contribution of this newly originated protein to human brain development53.
[ad_2]
Source link
