[ad_1]
Sequencing and genome structure of the complete mitogenome of P. serratifolia
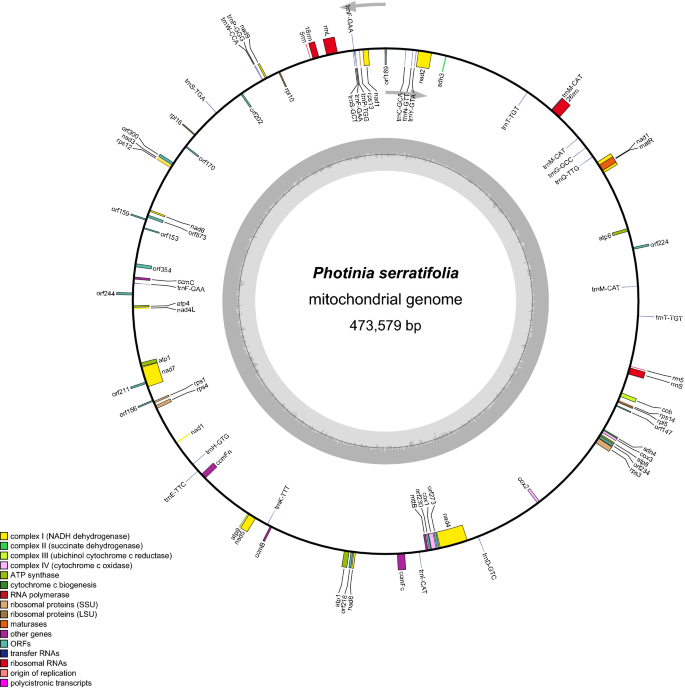
The total DNA of P. Serratifolia was sequenced, and the raw data had been prepared for assembly, resulting in 115.88 G Nanopore PromethION sequencing data with an average read length of 23,654 bp (61–26,706 bp) and 34.3 G Illumina sequencing data (Supplementary Table S1). We then assembled the complete mitogenome of P. serratifolia in a circular contig of 473,579 bp (Fig. 1), which has been deposited in the NCBI Genome Database (GenBank accession number: MZ153172). The mitogenomes of 19 species were selected for analysis in this study (Supplementary Table S2). It is well known that the plant mitogenome greatly varies in size, from 66 kb in V. scurruloideum21 to 11.3 Mb in S. conica22. As shown in Supplementary Table S2, the relatively medium size of the P. serratifolia mitogenome was smaller than that of Zea mays (680,603 bp) and Oryza sativa (490,520 bp). However, the mitogenome of P. serratifolia was slightly larger than Pyrus betulifolia (469,928 bp), Rhaphiolepis bibas (434,980 bp), and Malus hupehensis (422, 555 bp), and significantly larger than that of Sorbus aucuparia (384,977 bp) and Sorbus torminalis (386,758 bp). These results suggest that P. serratifolia may be identified as a species with a larger mitogenome in the Rosaceae family.
The nucleotide composition of the whole mitogenome is A: 27.6%, T: 27.2%, C: 22.7%, and G: 22.5%, and the overall GC content was 45.2% (Supplementary Table S2), which is consistent with that of most of the species of Rosaceae family we compared (M. hupehensis: 45.21%; Malus domestica: 45.4%; Prunus avium: 45.62%; P. betulifolia: 45.28%; S. aucuparia: 45.39%; S. torminalis: 45.31%) and other angiosperms (Ziziphus jujuba: 45.27%; A. thaliana: 44.79%; Glycine max: 45.03%), but smaller than some gymnosperm, such as Ginkgo biloba: 50.36%.
Gene contents of the mitogenome of P. serratifolia
Although the genome size of plant mitochondrial greatly varied, the number of mitochondrial genes is relatively conserved in the land plant lineage, with 60–80 known genes found in different terrestrial plant species29. In the P. serratifolia mitogenome, 67 genes (38 protein-coding genes, 23 tRNA genes, and 6 rRNA genes) were annotated (Supplementary Table S2). The functional categorization and physical locations of the annotated genes were shown in Fig. 1. The 38 encoded proteins (nad6 and atp1 have two copies) could be divided into 11 classes: ATP synthase (6), cytochrome C biogenesis (4), ubiquinol cytochrome c reductase (1), cytochrome C oxidase (3), maturases (1), transport membrane protein (1), NADH dehydrogenase (10), ribosomal proteins (large subunit (LSU); 3), ribosomal proteins (small subunit (SSU); 6), succinate dehydrogenase (2), and ribonuclease (1) (Supplementary Table S3).
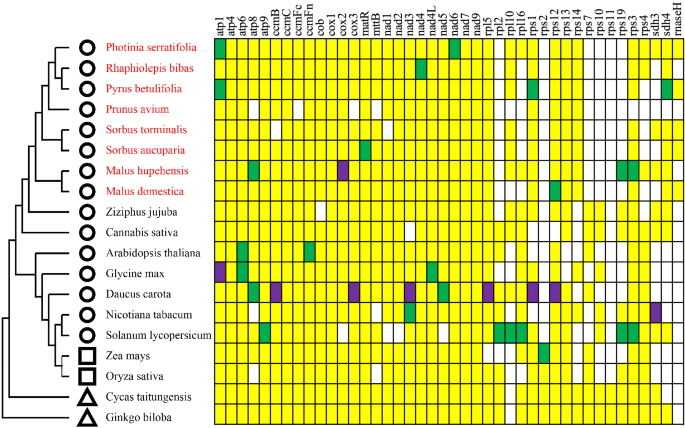
Although comparative analyses of mitogenomes have shown that the sequences of protein-coding genes are highly conserved in plants, variations among plant mitogenomes characterized so far have mainly been reported in the ribosomal proteins30,31. In addition, the gene components cytochrome c biogenesis gene has also been reported to be different among the plant mitogenomes32. Interestingly, consistent with previous mitogenome studies of Rosaceae33, most rps genes (rps2, rps7, rps10, rps11, rps19) were missing in the mitogenome of P. serratifolia (Fig. 2). The functions of missing ribosomal genes may be replaced by nuclear genes, which may be related to the rapid radiation evolution of Rosaceae plants34. Although there was no significant variation of the composition of cytochrome C synthase gene among other species of the Rosaceae family in our study, the length of ccmFc, ccmFn, cob, cox1, cox2, and cox3, in the mitogenome of P. serratifolia, R. bibas, and M. hupehensis, were 797–2271 bp, which was significantly higher than that of other species (212–587 bp) of the family.
Distribution of protein-coding genes in plant mitogenomes. Yellow, green, and purple boxes indicate that one, two, and three copies exist in the plant mitogenome, respectively. White boxes indicate that the gene is missing in the plant mitogenome. The circles, squares, and triangles represent dicots, monocots, and gymnosperms, respectively. Besides, the red-colored plant names are species from the Rosaceae family.
Other than ribosomal proteins, the major variations characterized among plant mitogenomes, even in the same genus, are in the tRNA gene contents30. The P. serratifolia mitochondria had 23 tRNAs (Supplementary Table S3). The average length of these tRNAs was 71–87 bp, with a total length of 1725 bp (Supplementary Table S3). The number of tRNAs in the P. serratifolia mitogenome was more than that in other species of the Rosaceae family, such as R. bibas (22), M. domestica (20), P. avium (16), and S. torminalis (18) (Supplementary Table S2). This may be because some tRNAs in the P. serratifolia mitogenome have multiple copies. For example, trnfM-CAT and trnF-GAA have two copies. The function of the missing mitochondrial tRNAs may be replaced by chloroplast-derived tRNAs in species with less mitochondrial tRNAs34. Moreover, consistent with the previous report35, we found that protein-coding genes of the P. serratifolia were not increased along with the increase of tRNAs.
Furthermore, we found that 61 out of the 67 mitochondrial genes have no introns, accounting for 92.54% of the total. Our result is consistent with the general consensus that 63.2% to 100% of mitochondrial genes in most plants have no introns17,18. However, six mitochondrial genes (ccmFC, nad5, nad1, nad2, nad4, and nad7) are found to contain one or more introns of the P. serratifolia (Supplementary Table S3).
Repeat sequences analysis
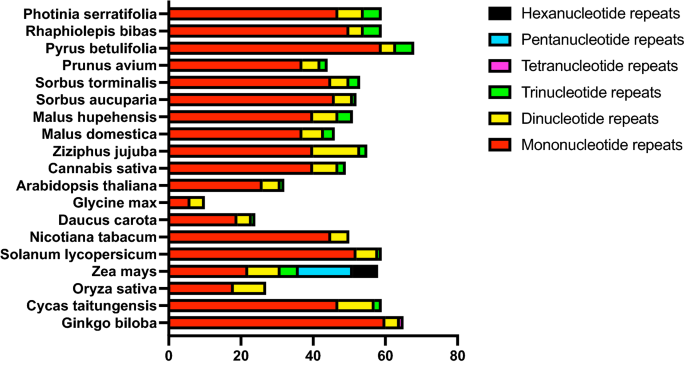
SSRs, or microsatellites, are DNA stretches consisting of short, tandem units of sequence repetitions of 1–6 base pairs in length36. In the current study, we identified 59 SSRs in the P. serratifolia mitogenome. The proportions of different repeat units were shown in Fig. 3. Consistent with all observed species, mononucleotide repeats were the most abundant SSR type in P. serratifolia, constituting 79.67% (47 repeats) of all identified SSRs. In addition, there were 7 SSRs (11.86%) and 5 SSRs (8.47%) in di-, trinucleotide repeats, respectively. However, there were no tetra-, penta-, and hexa-repeats identified in P. serratifolia mitogenome. The mononucleotide repeats of A/T motifs (a total of 41 repeats) were the most recurrent motifs, representing 69.49% of all identified SSRs (Supplementary Table S4). According to the trend that the distribution pattern of microsatellites is consistent with their phylogenetic status in plants37, the SSR composition of P. serratifolia was similar to its most closely related species, such as R. bibas and P. betulifolia (Fig. 3).
In addition, 72 non-tandem repeats, with 50 bp or more in length, were detected in the P. serratifolia mitogenome (Supplementary Table S5). The repetitive sequence in the P. serratifolia mitogenome was 51.05 kb, accounting for 10.78% of the mitogenome. The proportion of repeats is higher than that in Garcinia mangostana (5.8%)38 and Prunus salicina (7.22%)39, but lower than that in Nicotiana tabacum (13%)40 and Daucus carota (16%)41. The different proportions of repeats may be because the mitochondria of G. mangostana and P. salicina are mainly short repeating units, whereas those of P. serratifolia and D. carota are mainly longer repeating units41.
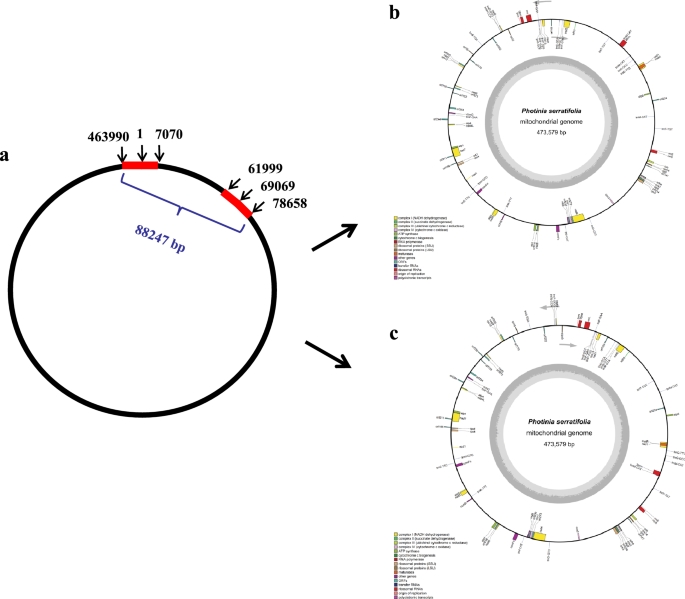
For example, we found one pair long repeat (16,660 bp), one copy at the starting and ending positions of the genome (463990-473579-1-7070), another at 61,999–78,658 bp (Fig. 4a), and 16 pair medium sized repeats between 120 and 920 bp in the P. serratifolia mitogenome (Supplementary Table S5). The distribution of repeat is consistent with many plant mitogenomes that have one or more pairs of large repeats38,42,43. Some reports showed that larger and medium-sized repeats can act as sites for inter- or intramolecular recombination, leading to multiple alternative arrangements or isoforms42,43. Although the frequency of recombination events was low, all these sequencing reads were aligned to the P. serratifolia mitogenome for the detection of potential alternative isoforms. As a benefit of Nanopore PromethION sequencing, these ultra-long reads of P. serratifolia, with an average read length of 23,654 bp, is longer than these identified repeats. Therefore, the long reads can cover identified repeats with high probability. As shown in Fig. 5, the sequencing reads coverage of these repeats is similar to those of other non-repetitive sequences, which implies no branching nodes in each repeat. Therefore, P. serratifolia mitochondrial master genome assembly can be represented in the circular form, as previously reported in plant mitogenomes20,38,44. However, there is a total length of 88,247 bp between the two copies of the long repeats (Fig. 4a), which may give rise to an alternative configuration of mitogenomes via inversions of these long repeats in master conformation (Fig. 4b,c).
The distribution of the pair of long repeats and the possible configurations generated from inversions of these long repeats. a: The distribution of the pair of long repeats (16660 bp) (red bars) in the P. serratifolia mitogenome. b and c: Two possible configurations generated from inversions of these long repeats. b is the master conformations, which is same as Fig. 1 shown. c is an alternative configuration of mitogenomes of P. serratifolia.
The prediction of RNA editing in the P. serratifolia mitogenome
The number of RNA-editing sites varies in different species and is usually frequent in angiosperm and gymnosperm mitochondria45. We predicted 488 RNA-editing sites within the 33 protein-coding genes (Fig. 6) in the P. serratifolia mitogenome, which was similar to those in A. thaliana (441 sites)15, Eucalyptus grandis (470 sites)46, and Citrullus lanatus (463 sites)47 and less than those in gymnosperms that have larger mitogenomes, such as Taxus cuspidata (974 sites), Pinus taeda (1179 sites), Cycas revoluta (1206 sites), and G. biloba (1306 sites)48. However, whether the number of RNA-editing sites is positively correlated with the size of the mitogenome requires further research.
The selection of mitochondrial RNA-editing sites in P. serratifolia shows a high degree of compositional bias. As shown in Fig. 6, all RNA-editing sites are the C-T editing type, which is consistent with the fact that C-T is the most common editing type found in plant mitogenomes49,50. Inconsistent with previous studies50, more than half (313 sites, 64.14%) of the mitochondrial RNA editing occurred at the second codon position in P. serratifolia (Fig. 6), followed by that at the first codon position (161 sites; 32.99%) (Fig. 6). However, no editing site was found at the third position of triplet codons, consistent with the fact that RNA-editing sites at this position were rare in plant mitogenomes48,49.
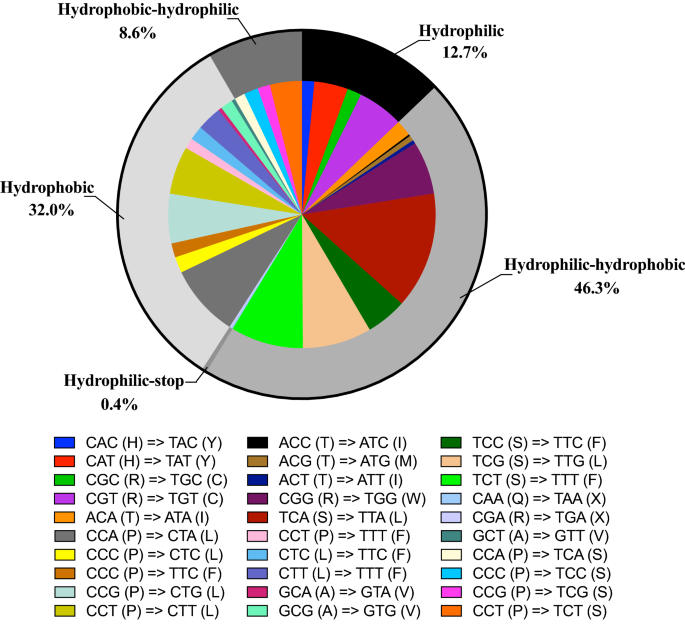
Although the P. serratifolia mitogenome has more RNA-editing sites, and the vast majority of RNA editing occurs at the first or second position of codons, there were only 30 codon transfer types, corresponding to 14 amino acid transfer types, suggesting a consolidated biological function. The types of transfer are comparable to those of most gymnosperms (30–40 codons; around 20 amino acids)48,50 but less than those of monocotyledonous and dicotyledonous plants (50–60 codons; around 30 amino acids)46,47,49. Among the 30 codon transfer types, TCA = > TTA was the most common type, with 68 sites. A leucine tendency after RNA editing, supported by the fact that 44.88% (219 sites) of the edits were converted to leucine, was found in the amino acids of predicted editing codons. After RNA editing, 32.0% of the amino acids remained hydrophobic. However, 46.3% of the amino acids were predicted to change from hydrophilic to hydrophobic, while 8.6% were predicted to change from hydrophobic to hydrophilic. Overall, our study suggests that the P. serratifolia mitogenome has more RNA-editing sites but fewer editing types.
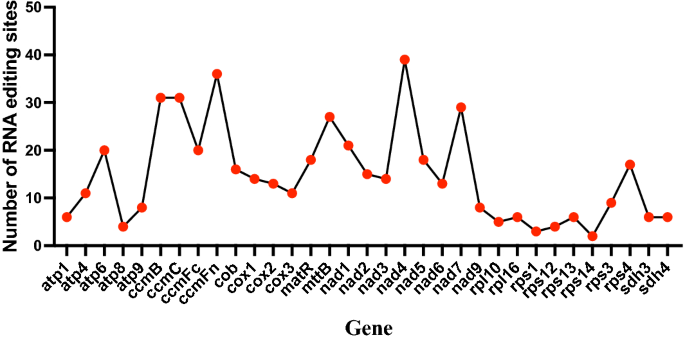
It has been well established that RNA editing is an epitranscriptomic mechanism that modifies primary RNAs, and is widespread in plants organelles51, Fig. 7 shows the total number of editing sites of all of the 33 protein-coding genes. Although the pattern changes of RNA editing extent varies between different plant species52, similar to most angiosperms50, ribosomal proteins (except rps4) and ATPase subunits (except atp6) had a relatively small number of RNA-editing-derived substitutions (2–11 sites), while the transcripts of NADH dehydrogenase subunits and cytochrome c biogenesis genes were significantly edited (13–39 sites; Fig. 7) in the P. serratifolia mitogenome. Consistent with the previous report, such as Phaseolus vulgaris26 and Suaeda glauca53, nad4 (36 sites), ccmFn (39 sites), and ccmB (31 sites) had the highest total number of RNA-editing sites predicted in the P. serratifolia mitogenome (Fig. 7). This supports the essential role of editing sites in the proper functioning of mitochondrially encoded proteins.
Codon usage and Ka/Ks analysis
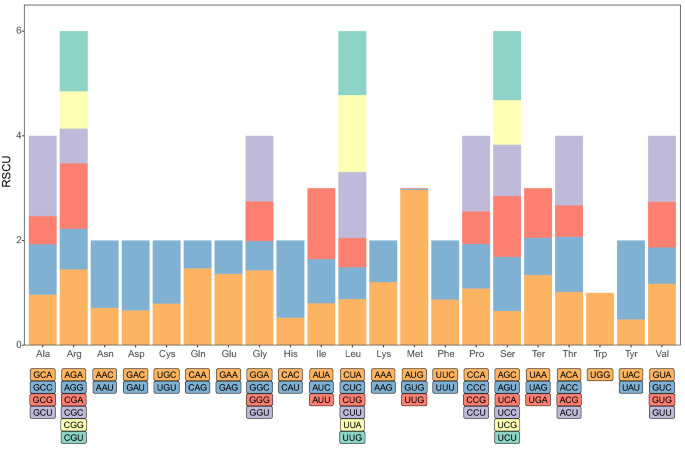
As shown in Supplementary Table S3, in the P. serratifolia mitogenome, ATG was used as the starting codon by almost all the protein-coding genes, while mttB starts with TTG, rpl16 and rps4 start with GTA as the start codon. Three types of stop codons, TAA, TGA, and TAG, were found in the P. serratifolia mitogenome which had utilization rates of 44.7%, 31.6%, and 23.7%, respectively (Supplementary Table S3). The relative synonymous codon usage (RSCU) value for P. serratifolia for the third codon position is shown in Fig. 8. Consistent with most of the currently studied mitogenomes10,53,54, the use of both two- and four-fold degenerate codons was biased toward the use of codons abundant in A or T. In P. serratifolia, 14,333 amino acids were encoded. The most frequently used amino acids were Leu (7.1%), Arg (6.3%), and Ser (6.1%), and the least common amino acids were Trp (1.4%) and Met (1%) (Fig. 8).
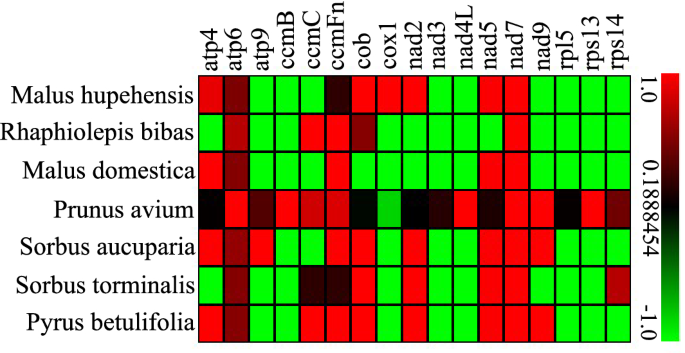
In genetics, the Ka and Ks substitution ratio (Ka/Ks) is useful for inferring the direction and magnitude of natural selection across diverged species55. A Ka/Ks ratio < 1 implies negative selection, while a ratio of > 1 implies positive selection (driving change) and a ratio of exactly 1 indicates neutral selection. To evaluate selective pressures during the evolutionary dynamics of protein-coding genes among closely related species, the Ka/Ks ratio of 17 single copy PCGs among P. serratifolia and 7 Rosaceae species mitogenomes was calculated. As shown in Fig. 9, there was no substitution in most mitochondrial genes, such as rpl5, rps13, rps14, nad3, nad4L, atp9, ccmB, and cox1, among P. serratifolia and other seven species in Rosaceae. More frequency changes were found in atp genes among species.
In 21 cases (Fig. 9), Ka/Ks values of P. serratifolia gene-specific substitution rates were higher than 1. This result suggests a positive selection during the evolution of P. serratifolia as compared with 7 other species55,56 Among these cases, the Ka/Ks values of the nad gene-specific substitution rates of P. serratifolia were higher, with Ka/Ks values of 7 nad7 genes and 4 nad3 > 1, suggesting large variation and positive selection during nad gene evolution among Rosaceae55. However, most genes had undergone negative selection pressures during evolution, supported by the fact that the Ka/Ks values of 86 proteins-coding genes, accounting for 72.69% of the proteins-coding genes, were less than 1 compared to the other plant species. Taken together, these results suggest that mitochondrial genes are highly conserved during the evolutionary process in Rosaceae plants.
Phylogenetic analyses
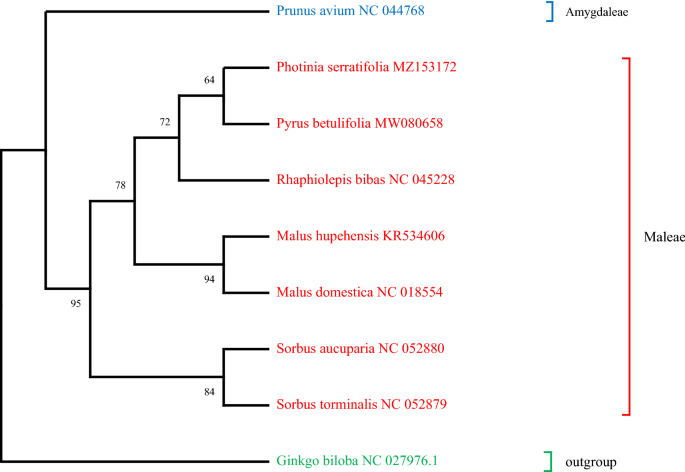
To detect the evolutionary status of the P. serratifolia mitogenome, a phylogenetic analysis was performed on P. serratifolia, together with 8 other species. Phylogenetic relationships (Fig. 10) were analyzed using the concatenated dataset by 17 PCGs through ML phylogenetic analysis. The abbreviations and accession numbers of the mitogenomes investigated in this study are listed in Supplementary Table S2. As shown in Fig. 10, as outgroups, the G. biloba, which belongs to gymnosperm, was distinct from the other angiosperms. Moreover, the taxa of the 7 Rosaceae species were well clustered. Among the Rosaceae cluster, P. avium, which belongs to Amygdaleae subfamily, was distinct from the other 7 species of Maleae subfamily, which also supports the classification of Amygdaleae and Maleae subfamily57,58. Meanwhile, these species in the same genus were clustered together, such as S. aucuparia and S. torminalis, M. hupehensis and M. domestica, which is consistent with previous reports based on morphological and genetic data57,58,59.
In addition, we also found that the clade united P. serratifolia with P. betulifolia (Fig. 10). The present phylogenetic analysis shows that R. bibas is sister to P. serratifolia + P. betulifolia, which is consistent with the previous report60. Our results also support the groupings (Sorbus + (Malus + (Rhaphiolepis + (Photinia + Pyrus)))), which have been partly supported in the previous study61. However, more accurate sequence and increased taxa sampling are necessary to further research the monophyly of these genus at the mitogenomes level. In general, the phylogenetic tree topology was in line with the evolutionary relationships among those species, indicating the consistency of traditional taxonomy with the molecular classification.
[ad_2]
Source link
